The wearable technology market has grown from a niche curiosity to a mainstream wellness tool in less than a decade. More than 500 million wearable devices — smartwatches, fitness trackers, rings, patches, and biosensors — are now in use worldwide, generating an estimated 7 exabytes of health data annually. For the first time in history, individuals have access to continuous, longitudinal records of their own physiological states across multiple dimensions. But raw data is not wisdom. The challenge — and the opportunity — lies in transforming this flood of measurements into meaningful guidance for better health.
The Data Landscape
Modern consumer wearables capture a remarkable range of physiological signals. Activity tracking — steps, distance, floors climbed, active minutes — was the starting point for the category, but current devices now measure far more. Optical heart rate sensors, once accurate only for resting measurements, have improved to the point where many devices can provide continuous heart rate monitoring during exercise and detect atrial fibrillation with clinically relevant accuracy.
Sleep tracking through accelerometers and photoplethysmography has become a standard feature of mid-range and premium wearables, providing estimates of sleep duration, efficiency, and stage distribution. Skin temperature sensors enable detection of circadian disruption, fever onset, and — with appropriate algorithms — menstrual cycle tracking. Blood oxygen saturation (SpO2) monitoring, added to most premium wearables in the past several years, provides screening capabilities for sleep apnea and altitude adaptation.
Newer sensors are expanding the physiological measurement envelope further. Electrodermal activity (EDA) sensors on recent Fitbit and Oura devices measure stress-related sympathetic nervous system activation. Bioelectrical impedance sensors enable body composition estimation. Continuous blood pressure estimation through pulse wave analysis is available on some premium devices, though accuracy continues to improve.
Understanding Heart Rate Variability
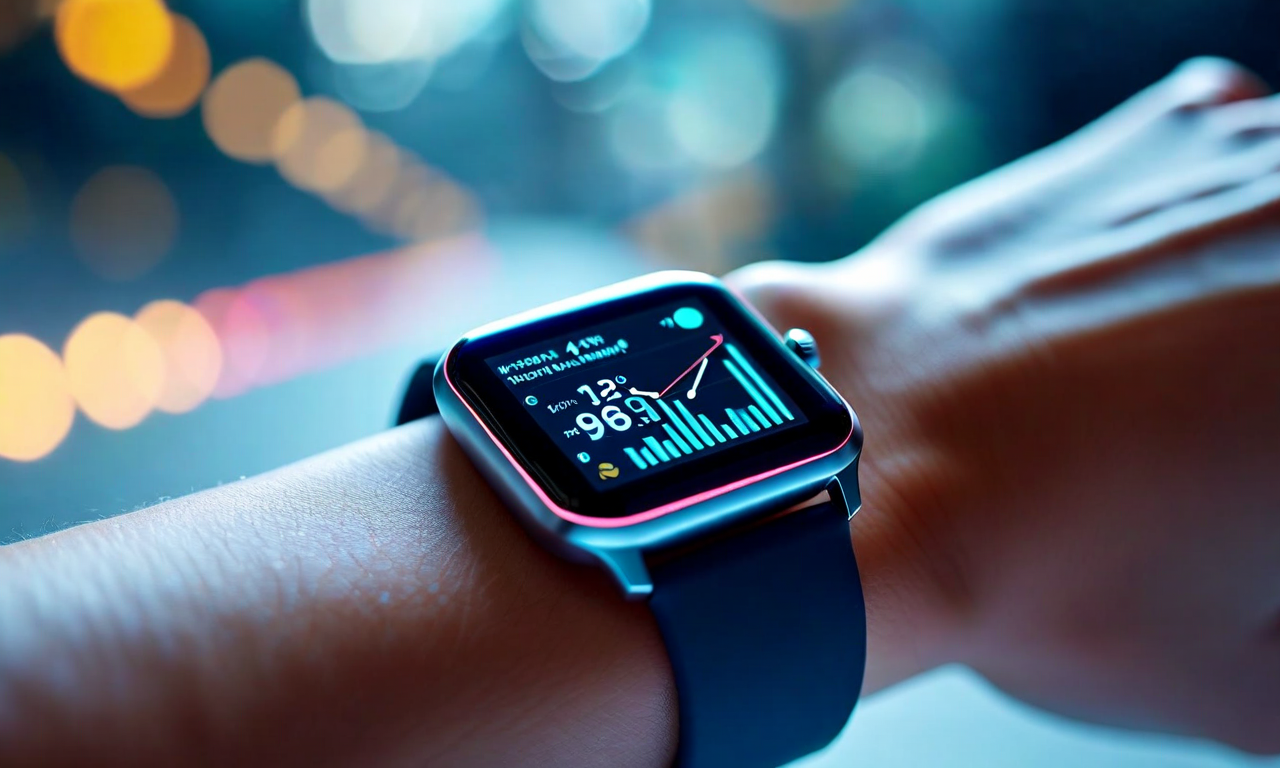
Heart rate variability has emerged as one of the most information-rich metrics available from consumer wearables, yet it remains poorly understood by most users. HRV measures the millisecond-level variation in time between consecutive heartbeats — a counterintuitive phenomenon, since many people assume healthy hearts beat like metronomes. In fact, the variation between beats reflects the continuous push-pull interplay between the sympathetic (activating) and parasympathetic (restorative) branches of the autonomic nervous system, making HRV one of the best available proxies for physiological recovery status and stress load.
High HRV generally indicates that the body is in a good recovery state — parasympathetic tone is elevated, physiological stress is low, and the organism has resources available for performance and adaptation. Low HRV signals elevated sympathetic activation, which can result from physical training load, psychological stress, inadequate sleep, illness onset, or excessive alcohol consumption. Tracking HRV trends over weeks and months enables personalized insights into recovery patterns that would be invisible from any single-day measurement.
Making Sense of Sleep Data
Sleep stage data from consumer wearables has the greatest potential to improve health understanding and the most significant accuracy limitations. Current consumer devices estimate sleep stages through a combination of movement and heart rate data, an approach that correlates reasonably well with polysomnography for distinguishing sleep from wakefulness and for gross estimates of REM sleep, but is less reliable for distinguishing light from deep sleep stages.
The most valuable sleep metrics from consumer wearables are sleep efficiency (percentage of time in bed actually asleep), sleep consistency (regularity of sleep and wake timing), and HRV during sleep (physiological recovery quality). These metrics are more reliably measured than sleep stage estimates and more strongly connected to meaningful health outcomes in the research literature.
Interpreting Activity Data Wisely
Activity data is simultaneously the most established and most oversimplified category of wearable measurement. Step count targets have dominated the consumer fitness tracking narrative, but the relationship between step count and health outcomes is mediated by numerous factors that step count alone does not capture. Intensity distribution, movement variety, sitting time breaks, and activity timing relative to meals and sleep all significantly influence the health impact of any given volume of physical activity.
More meaningful activity analysis focuses on active zone minutes — time spent at moderate and vigorous intensity — rather than steps alone. Weekly patterns of intensity distribution and identification of sedentary periods provide more actionable guidance than daily step totals. For users interested in athletic performance, training load metrics that balance acute workload against chronic fitness provide the most sophisticated framework for optimizing the stress-recovery cycle.
Platform Integration: The Whole Greater Than the Sum of Parts
The greatest limitation of single-device wearable data is its isolation. A smartwatch captures activity and heart rate; a ring captures sleep and temperature; a scale captures weight and body composition; a blood glucose monitor captures glycemic response — but in separate apps with no communication. The insights available from integrating these streams into a unified platform vastly exceed what any single source can provide.
This integration is the core value proposition of comprehensive wellness platforms: the ability to surface correlations across data types that reveal the genuine patterns driving individual health. When wearable data is combined with mood tracking, nutritional logs, and behavioral inputs, the resulting picture provides genuinely personalized, actionable health intelligence that empowers users to make meaningful improvements in their wellness trajectories.